
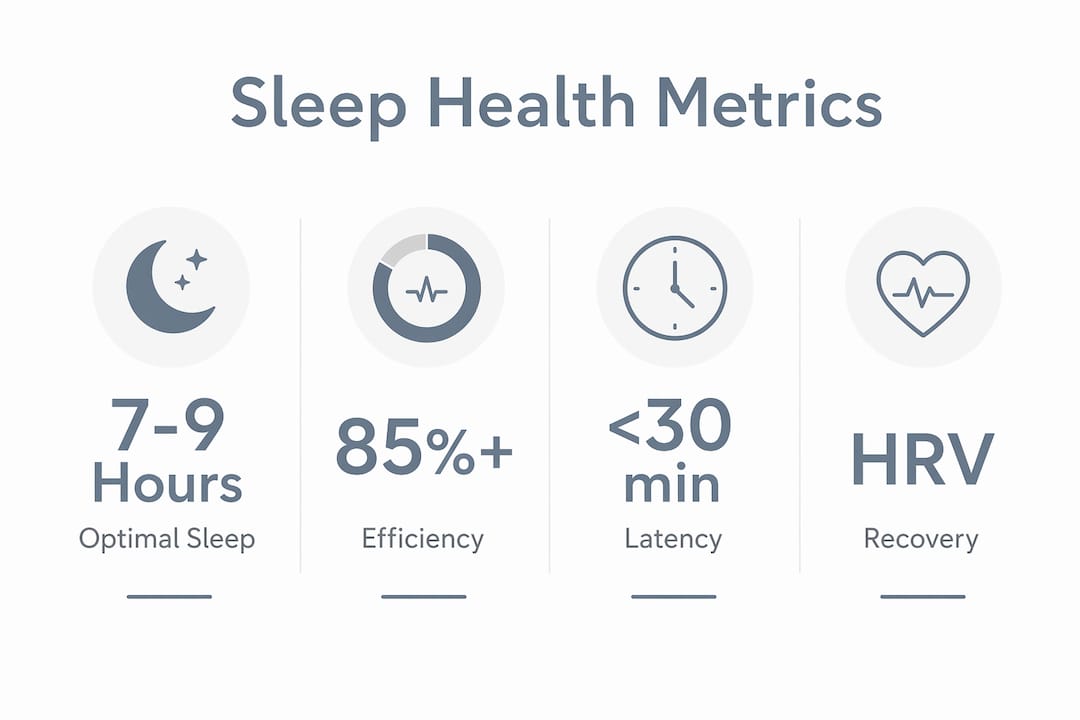
Sleep health monitoring is the practice of tracking specific data points, including sleep duration, efficiency, latency, and heart rate variability (HRV), to gain clear insights into your rest quality and recovery. The National Sleep Foundation and the American Academy of Sleep Medicine (AASM) define healthy sleep for adults as 7–9 hours per night, with sleep efficiency at or above 85% and sleep latency under 20 minutes. Consumer-grade wearables and phone apps now make it possible to collect these metrics nightly without a clinical setting. This monitor sleep health metrics guide explains what each number means, how to read it accurately, and what to do when the data points to a problem.
What are the essential sleep health metrics and how do you interpret them?
Sleep health monitoring rests on four core metrics: duration, efficiency, latency, and HRV. Each one tells a different part of the story, and reading them together gives you a far clearer picture than any single score.
Sleep duration vs time in bed
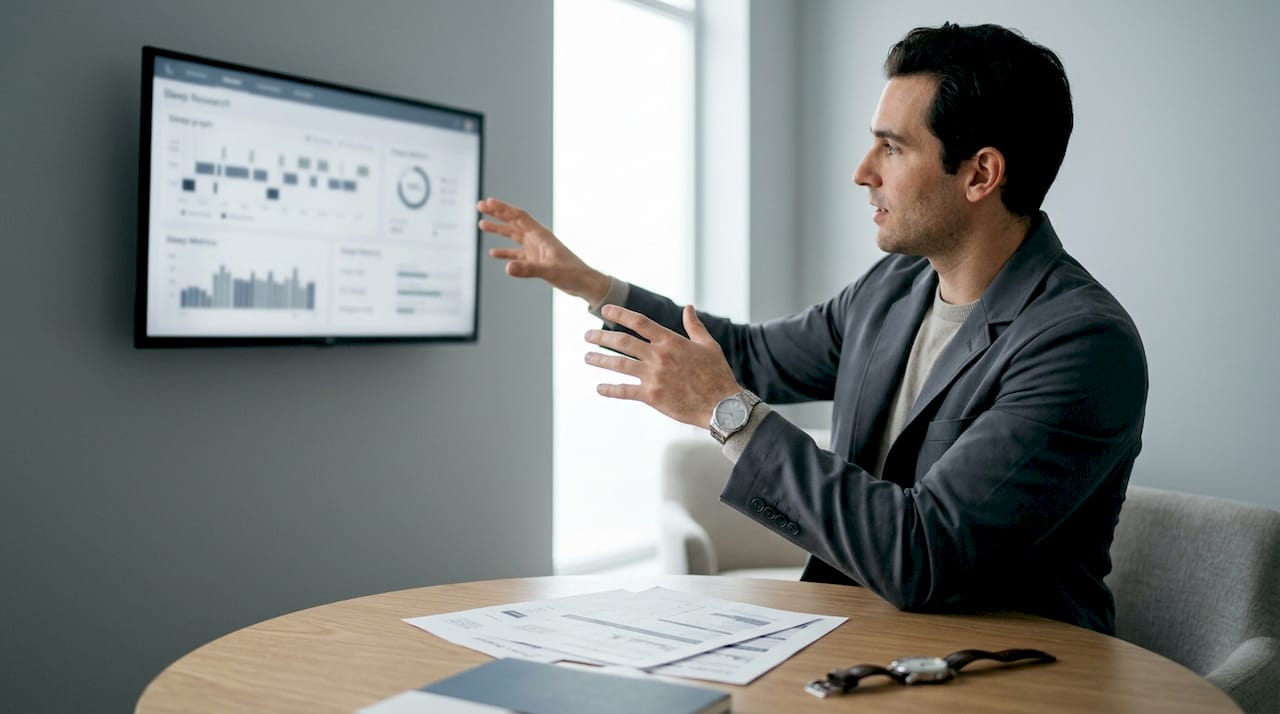
Sleep duration is the total time you are actually asleep, not the total time you spend in bed. A person who lies down for nine hours but wakes repeatedly may log only six hours of true sleep. The AASM target of 7–9 hours of sleep refers to actual sleep time, not time in bed. Consistently falling short of seven hours is linked to impaired cognition and weakened immune response.
Sleep efficiency and latency
Sleep efficiency is calculated as actual sleep time divided by time in bed, expressed as a percentage. A score of 85% or above is the clinical threshold for healthy sleep. Sleep latency is how long it takes you to fall asleep after the lights go out. Latency regularly above 30 minutes may indicate poor sleep hygiene or an underlying sleep disorder worth investigating with a clinician.
Heart rate variability and recovery
HRV measures the variation in time between consecutive heartbeats and reflects how well your autonomic nervous system has recovered overnight. Higher HRV generally indicates better recovery capacity. Because HRV fluctuates daily due to stress, alcohol, and illness, multi-week HRV trends are far more meaningful than any single night’s reading. A sustained HRV decline of over 20% across two weeks signals physiological stress that warrants a lifestyle review.
Sleep stages and their limitations
Consumer trackers report time spent in light, deep, and REM sleep. Deep sleep detection is reasonably reliable because it correlates with physical stillness and a lower heart rate. REM sleep is frequently misclassified by consumer devices due to overlapping physiological signals, so treat REM percentages as approximate rather than definitive. Consumer trackers achieve roughly 60–70% accuracy in sleep stage classification compared to clinical polysomnography. That gap does not make trackers useless. It means you should focus on trends across weeks rather than reacting to a single night’s stage breakdown.
Pro Tip: Track your sleep midpoint, the halfway point between when you fall asleep and when you wake. A consistent sleep midpoint is a reliable indicator of circadian rhythm stability and is often more trustworthy than erratic stage percentages.
How to effectively track your sleep quality using consumer devices
Selecting the right tracking method and setting it up correctly determines whether your data is useful or misleading. The two main categories are wrist-worn wearables and smartphone apps that use the accelerometer to detect movement.
Choosing your tracking method
Wrist-worn wearables measure heart rate, movement, and skin temperature to infer sleep states. Smartphone apps placed on the mattress rely primarily on movement. Wearables generally produce richer data because they capture HRV and heart rate alongside motion. Phone apps are a lower-cost entry point and still capture sleep duration and latency reasonably well. Wellness devices that support sleep can complement either approach by addressing the environmental factors that trackers measure but cannot fix.
Setting up for consistent, meaningful data
Consistency is the single most important factor in getting useful sleep data. Follow these steps to build a reliable baseline:
- Wear or place your tracker the same way every night to eliminate positional variables.
- Set a fixed bedtime and wake time so your tracker can identify your sleep window accurately.
- Log lifestyle factors such as alcohol, caffeine intake, and exercise in your tracker’s companion app. This context makes your data interpretable.
- Sync your tracker with a centralised health platform (Apple Health or Google Fit) so data persists even if you change devices.
- Review your data weekly, not nightly. Multi-week averages reveal real patterns; single nights reveal noise.
Pro Tip: Give any new tracker at least two weeks before drawing conclusions. The device needs time to learn your baseline HRV and movement patterns before its algorithms produce reliable output.
Sleep trackers are behavioural pattern indicators, not diagnostic tools. Clinicians advise that trackers should never replace professional diagnosis or treatment. If your data consistently shows fragmented sleep or very low efficiency, bring the trend data to your GP rather than self-diagnosing.
What are practical steps to improve sleep quality from your tracked data?
Your tracker identifies patterns. What you do with those patterns determines whether your sleep actually improves. The following strategies address the most common metric problems people see when they begin tracking.
Improving sleep efficiency
Low efficiency almost always traces back to spending too long in bed while awake. Restrict your time in bed to your actual sleep window rather than lying there hoping sleep will come. Consistent sleep hygiene best practices, including a cool bedroom (around 18°C), blackout curtains, and no screens for 60 minutes before bed, raise efficiency scores reliably over two to three weeks.
Reducing sleep latency
High latency is often a stress and arousal problem. A wind-down routine that begins 60–90 minutes before bed signals to your nervous system that sleep is approaching. Breathing exercises, light stretching, and consistent wake times all reduce latency. Alcohol shortens latency initially but fragments sleep in the second half of the night, which shows up as poor efficiency and reduced deep sleep in your tracker data.
Supporting HRV through lifestyle choices
HRV responds directly to stress load, alcohol consumption, and body temperature at sleep onset. Reducing alcohol to fewer than two units on weekday evenings, managing evening stress through structured relaxation, and keeping your bedroom cool all support HRV recovery. Exercise improves HRV over time, but intense training within three hours of bed temporarily suppresses it. Track the timing of your workouts alongside your HRV data to find your personal threshold.
- Prioritise sleep duration, deep sleep percentage, and consistency as your primary metrics when you are new to tracking.
- Avoid caffeine after 2:00 PM, as its half-life of approximately five to six hours means it is still active at midnight for most people.
- Keep your bedroom temperature between 16°C and 19°C. Core body temperature must drop to initiate sleep, and a cool room accelerates that process.
- Seek professional advice if your sleep latency consistently exceeds 30 minutes or your efficiency stays below 75% for more than three weeks.
Pro Tip: Sleep experts consistently advise that consistent sleep and wake times produce greater long-term health benefits than chasing a perfect nightly score. Set your alarm for the same time every morning, including weekends, before adjusting anything else.
Common mistakes in sleep health monitoring and how to avoid them
Most tracking errors fall into two categories: misreading the data and letting the data cause anxiety. Both undermine the purpose of monitoring.
The most frequent mistake is reacting to a single bad night. One night of poor sleep efficiency or low HRV means very little on its own. Sleep scores from consumer trackers use proprietary, non-standardised algorithms, so a single score is essentially noise. Multi-week averages are the only reliable signal.
- Do not treat REM sleep percentages as accurate. REM is frequently misclassified by consumer devices, and obsessing over REM figures leads to false conclusions.
- Avoid comparing your scores to population averages. HRV norms vary significantly by age, fitness level, and genetics.
- Do not use your tracker’s score as a measure of how you should feel. If you feel rested, a low score is a tracker error, not a health crisis.
- Pause tracking for one to two weeks if you notice that checking your score is the first thing you do each morning and that a low score affects your mood or energy.
Orthosomnia is an unhealthy preoccupation with achieving perfect sleep scores, and it directly worsens the sleep quality it is meant to improve. Excessive focus on sleep scores creates performance anxiety at bedtime, which raises arousal and delays sleep onset. If your tracker is making you anxious, it is working against you.
The solution is to treat your tracker as a weekly review tool rather than a nightly report card. Check your seven-day averages on a Sunday morning, note any trends, and adjust one behaviour at a time.
Key takeaways
Effective sleep health monitoring requires reading multi-week trends across duration, efficiency, latency, and HRV rather than reacting to individual nightly scores.
| Point | Details |
|---|---|
| Clinical targets matter | Aim for 7–9 hours of sleep, efficiency above 85%, and latency under 20 minutes. |
| HRV needs context | A sustained HRV drop of over 20% across two weeks signals stress, not a single low reading. |
| Stage data has limits | Consumer trackers reach only 60–70% accuracy for sleep stages; use trends, not single nights. |
| Consistency beats perfection | Fixed sleep and wake times improve long-term health more reliably than chasing high scores. |
| Orthosomnia is a real risk | Anxiety about sleep scores worsens sleep; review data weekly, not nightly. |
Why I think most people are using sleep trackers backwards
I have spent years watching people collect sleep data and draw exactly the wrong conclusions from it. The most common pattern is this: someone buys a wearable, checks their score every morning, and within a fortnight they are more anxious about sleep than they were before they started tracking. The tracker has not improved their sleep. It has given their anxiety a new focus.
The insight that changed how I think about this came from noticing that the people who sleep best are rarely the ones with the most data. They are the ones with the most consistent habits. They go to bed at the same time, they keep their bedroom cool and dark, and they do not lie awake worrying about their REM percentage. Their trackers confirm good sleep because their behaviour produces good sleep. The data follows the habit, not the other way around.
My honest recommendation is to use your tracker to identify one specific problem, fix it, and then step back. If your latency is high, work on your wind-down routine. If your efficiency is low, tighten your sleep window. Do not try to optimise every metric simultaneously. That path leads to orthosomnia, and the research is clear that it makes things worse.
The most underrated metric in any tracker is sleep midpoint consistency. If your midpoint shifts by more than 90 minutes between weekdays and weekends, your circadian rhythm is misaligned, and no amount of score-chasing will fix that. Stabilise your midpoint first. Everything else tends to follow.
— Hadi
Somnastudioshop products that support your sleep environment
Tracking your sleep metrics shows you where the problems are. Addressing the environment and physical comfort that your tracker cannot fix is the next step.
Somnastudioshop designs products specifically for the physical conditions that disrupt sleep. The SomnaPulse microcurrent device uses microcurrent technology to support relaxation and reduce the physical tension that raises sleep latency and suppresses HRV recovery. The SomnaAura Bluetooth sleep sound mask combines light blocking with white noise and audio playback to address two of the most common environmental disruptors: light pollution and ambient noise. Both products work alongside your tracking data rather than replacing it, giving you the physical conditions your metrics are telling you that you need.
FAQ
What is a healthy sleep efficiency score?
Sleep efficiency of 85% or above is the clinical benchmark for healthy adults. Scores below 80% sustained over several weeks warrant a review of your sleep habits or a conversation with your GP.
How accurate are consumer sleep trackers for sleep stages?
Consumer trackers achieve approximately 60–70% accuracy for sleep stage classification compared to clinical polysomnography. Deep sleep detection is more reliable than REM classification, which is frequently misclassified.
What does a drop in HRV mean for my sleep health?
A sustained HRV decline of over 20% across two weeks indicates physiological stress or poor recovery. A single low HRV reading is normal and should not cause concern on its own.
What is orthosomnia and should I be worried about it?
Orthosomnia is anxiety caused by excessive focus on sleep tracking scores, and it directly worsens sleep quality. If checking your sleep score affects your mood or energy, reduce your review frequency to once per week.
When should I see a doctor about my sleep metrics?
Seek professional advice if your sleep latency consistently exceeds 30 minutes, your efficiency stays below 75% for more than three weeks, or your tracker flags frequent breathing disruptions during the night.